UX Case Study · Mobile App
Redesign of Enterprise
Rewards App
Click and Reward is a mobile app for store owners who capture merchandised assets and win rewards — discounts and freebies on their next lot order based on merchandising alignment with business goals.


01 — Context
The Challenge
Although bottlers were actively promoting the app and encouraging merchandisers to install it, user engagement remained critically low despite the app's clear benefits. The business was struggling to manage merchandising across remote European locations — directly impacting approximately 5% of sales.
Low user engagement despite active promotion by bottlers and clear reward incentives
Inability to manage merchandising across remote locations — ~5% sales impact
Unclear instructions and opaque scoring system causing user frustration and drop-off


02 — Discovery
Research Approach
Real users were store owners and merchandisers in remote European locations. In-person testing wasn't possible, so we set up remote usability sessions over Microsoft Teams — recording each call while participants used the app live on their own devices.
Each session covered 5 tasks and ran 30–40 minutes with 5 users. We measured task success rate, time on task, total clicks, and System Usability Scale (SUS) score.
Tasks assigned: Sign Up · Capture Scene & Submit · Check Best Result & Return to Home · Update Profile · Check Result Image & SKU Tab
03 — Usability Testing
Usability Test Metrics
All values are averages across 5 users. SUS scores above 80 are considered good; below 60 indicate significant usability problems.
| Task | Success Rate | Time on Task | Clicks | SUS Score |
|---|---|---|---|---|
| Sign Up | 100% | 3 min | 5 | 94 |
| Capture Scene & Submit | 80% | 5 min | 12 | 76 |
| Check Best Result & Go to Home | 60% | 4 min | 6 | 62 |
| Update Profile & Check Details | 100% | 5 min | 10 | 85 |
| Check Result Image & SKU Tab | 40% | 5 min | 20 | 38 |
The Check Result Image & SKU Tab task had a 40% success rate and SUS 38 — well below acceptable threshold. This became the primary redesign focus.
40% success · SUS 38
60% success · SUS 62
80% success · SUS 76
04 — Qualitative Research
User Interviews
We interviewed 3 users in depth to understand their daily context, motivations, and frustrations. Common patterns emerged around clarity of instructions, scoring transparency, and reward accessibility.
Heard about the app from a friend. Opens it while out to capture assets. Finds the interface clean but often unsure if assets were captured correctly — wishes for clearer in-context feedback.
Hasn't earned many rewards — difficulty achieving high enough scores. Wants more variety in reward options.
More guidance for accurate capture · Progress tracker · Leaderboard to compare with other users
Found the app in the store. Finds basic capture straightforward, but scoring system is opaque and confusing.
Doesn't understand how scoring works. Difficult to achieve scores high enough for rewards — discouraging.
More transparency around scoring · More frequent low-barrier reward opportunities · Clearer visual prompts
Actively seeks reward apps. Finds capture easy but sometimes unsure if assets were captured correctly.
Struggles to reach higher-value tiers. Finds navigation unintuitive in certain flows.
Better capture guidance · Progress tracker · More intuitive navigation structure
05 — Survey
Survey Results
A structured survey was distributed to a broader user base. Key findings below.
Below acceptable threshold — signals systemic usability issues requiring structural redesign.
Common rewards: discounts and gift cards. Satisfaction varied — users wanted more variety.
Key insight: 98% of users came via client setup — engagement and motivation must be built into the app experience itself, not assumed from external promotion.
06 — Define
User Persona
07 — Empathy Map
Understanding Maria's World
The empathy map consolidated qualitative data from all 3 user interviews and the survey into a unified view of what users say, think, do, and feel while using the app.

08 — User Journey
Maria's Journey with the App
Mapping Maria's day-to-day interaction revealed the key touchpoints, emotions, and friction points across the full reward cycle.
Reviews inventory, creates restocking list including cooler beverages — creates the context for app usage.
While restocking, opens the app and selects the asset capture option. Follows prompts to ensure clear, accurate photos.
Uploads captured images. Double-checks before finalising — anxiety point due to unclear validation feedback.
Navigates to rewards section to check progress and available incentives — discounts and promotional items.
Receives in-app notification of earned reward. Follows redemption instructions to apply discount at supplier checkout.
Considers incorporating the app into daily routine — critical retention moment.
09 — IA & Design
Information Architecture
After completing user research, we organized all features and configurations into a comprehensive IA covering all app categories and their relationships.

10 — Design System
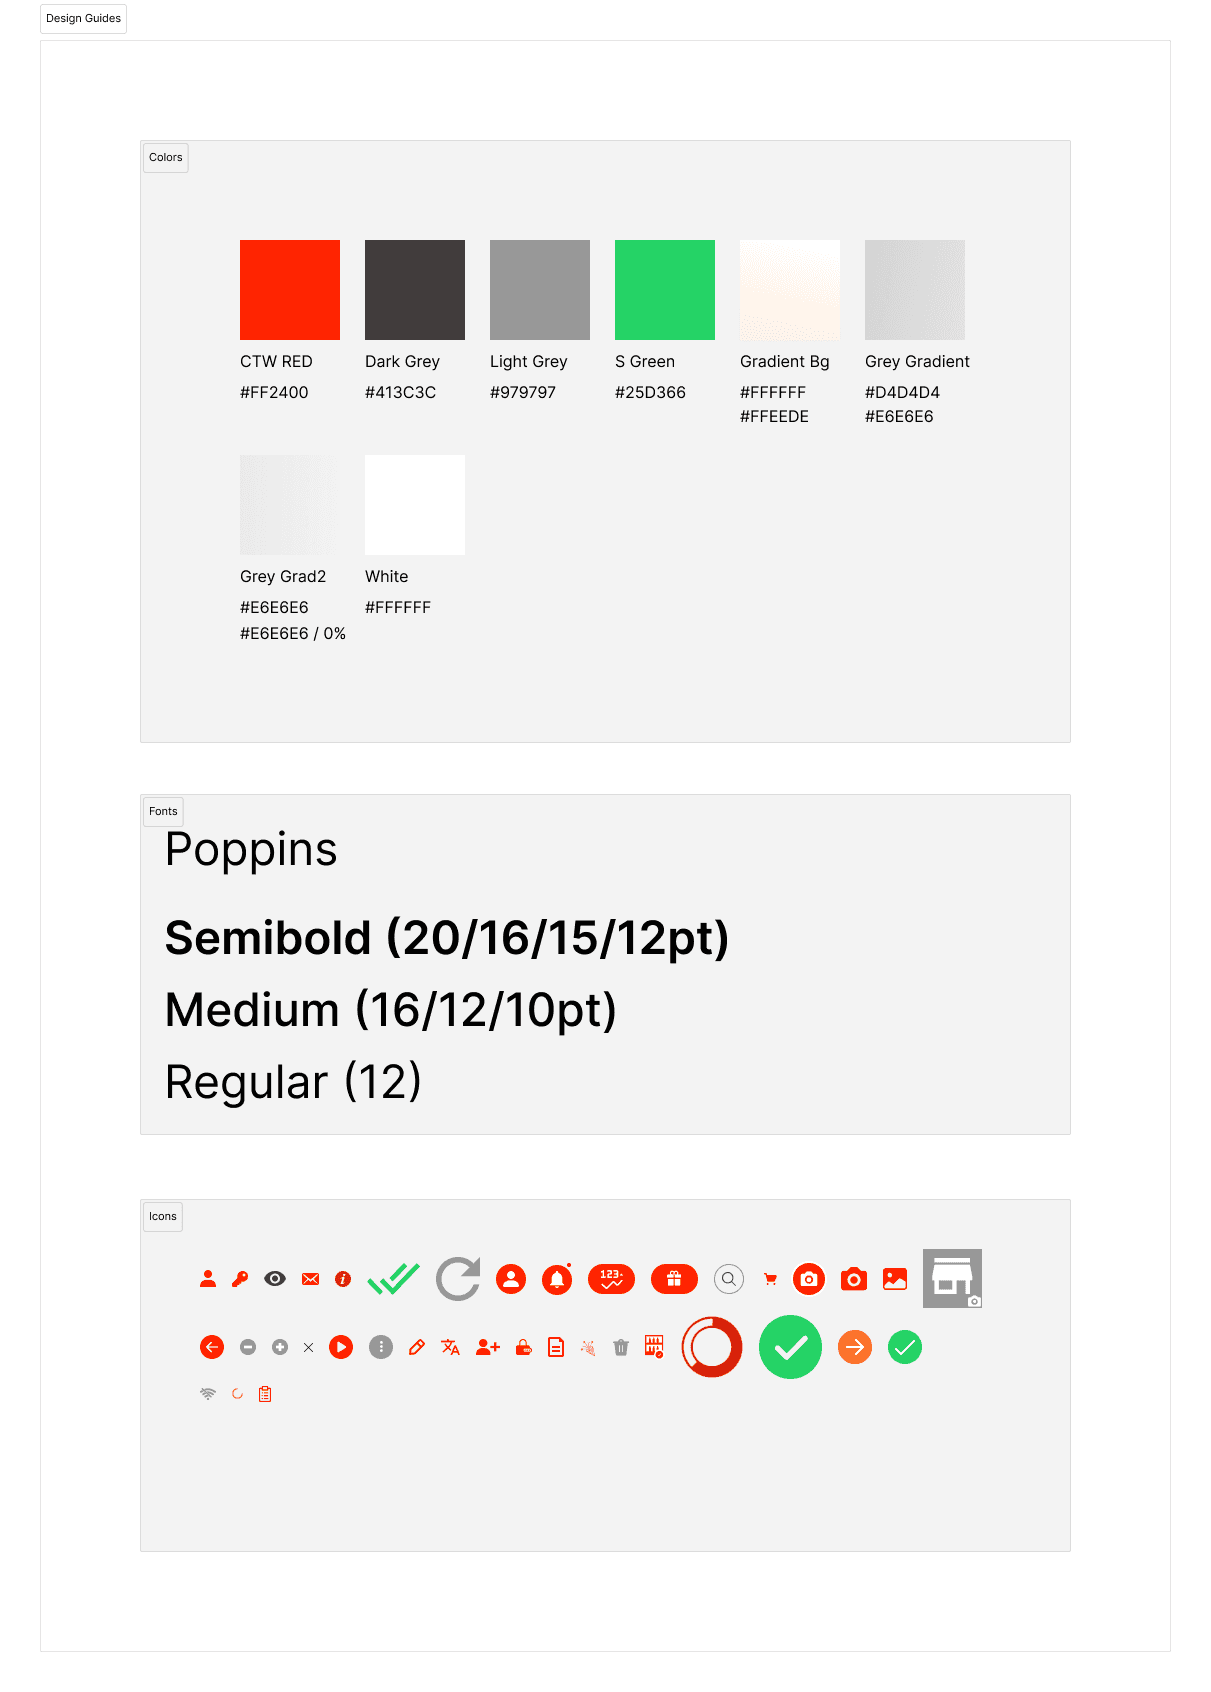
Design Guide
A focused design guide was established before moving into hi-fidelity — covering typography, colour tokens, spacing, component states, and iconography.
Lo-Fi Wireframes
Low-fidelity wireframes established the structural layout and component hierarchy before colour and branding were applied.

11 — Before vs After
Screen-by-Screen Redesign
Each screen was redesigned based on specific usability findings. The comparisons below show how targeted design decisions resolved the friction points identified in testing.
Splash Screen
|
Original — minimal branding
|
→ |
Redesigned — refined identity
|
| BEFORE | AFTER |
Home / Outlet Overview
| The original home screen showed flat outlet cards with ambiguous score states. The redesign added a clear balance display, better status indicators, and a search bar for quick outlet access. | ||
|
Original — cluttered, low hierarchy
|
→ |
Redesigned — clear status & balance
|
| BEFORE | AFTER | |
Asset Capture
| The original camera screen lacked clear guidance overlays. The redesign introduced grid alignment guides and an improved bottom action bar. | ||
|
Original — minimal capture guidance
|
→ |
Redesigned — grid guides & clear actions
|
| BEFORE | AFTER | |
Results & SKU Tab — Primary Redesign Focus
| The lowest-scoring flow (SUS 38, 40% success rate). The original mixed result images and tabs without clear hierarchy. The redesign separated concerns and improved information scanning. | ||
|
Original — SUS 38, 40% success
|
→ |
Redesigned — clear result breakdown
|
| BEFORE | AFTER | |
Score View
| The original score screen showed sub-period breakdowns in a raw table with no visual scoring context. The redesign introduced donut charts and a clearer period summary. | ||
|
Original — opaque score table
|
→ |
Redesigned — visual score breakdown
|
| BEFORE | AFTER | |

SKU Order List
|
Original — dense product list
|
→ |
Redesigned — streamlined order flow
|
| BEFORE | AFTER |
12 — Prototype Testing
User Testing & Opportunities
Prototype testing sessions with a diverse group — store owners, managers, and inventory staff — surfaced specific usability strengths and actionable improvement areas.


Participants found the onboarding intuitive and easy to follow. A few users suggested adding more visual cues or tooltips.
✓ Add contextual tooltips to onboardingUsers praised its simplicity and effectiveness. Clear prompts helped capture accurately, though some noted image recognition accuracy needed improvement.
✓ Improve image recognition accuracyNo major issues — the process was straightforward and seamless. Users suggested streamlining reward selection.
✓ Streamline reward selection flowNavigation found intuitive overall, but a few participants suggested organizing the menu more logically.
✓ Reorganize navigation menu hierarchyUsers appreciated notifications but noted occasional delivery delays.
✓ Improve notification delivery reliabilityProfile section was easy to use. Users requested additional customization options.
✓ Add notification preference controlsSearch was effective. Users suggested adding filters and sorting to refine results.
✓ Add filters & sort to searchNo difficulty using the camera. Clear instructions and visual feedback helped users complete capture efficiently.
✓ Maintain current camera UX patterns13 — Recommendations
Design Recommendations
Based on the full research and testing cycle, six prioritized improvements were proposed to the product team.
Improve image recognition accuracy to ensure valid asset capture results and reduce resubmissions
Streamline reward selection and provide clearer information about redemption options and tiers
Reorganize the navigation menu for improved logical flow and accessibility to key features
Enhance notification delivery reliability to ensure timely alerts for earned rewards
Add customization options for notification settings and account preferences in profile section
Add filters and sorting options to search results for faster outlet and product discovery
14 — Outcomes
Results
The redesigned app features a clean, clutter-free interface that makes it significantly easier for users to navigate, capture assets, and access rewards — validated through post-launch metrics.
Personalization and customization options — combined with clearer onboarding and a restructured rewards flow — directly drove engagement improvements within the first 30 days post-launch.