UX Case Study · SaaS Portal
SaaS Portal
Navigation Redesign
Redesigned a customer portal to eliminate navigation friction — reducing task completion time by 88% and improving portal satisfaction from 4.2 to 7.8/10.

Cross-functional scope: I was the only designer on this project. I drove alignment across Product (who owned the roadmap), Engineering (capacity constraints), and Ops leadership (who had conflicting requirements around new hire onboarding vs. power-user efficiency). Every major design decision required negotiating across all three.
00 — Executive Summary
One-Minute Overview
The Customer Portal is a business-critical tool used daily by 100+ operations staff across sales, retail audit, and program management teams. Over 18 months, the module count had grown from 12 to 30+ without any IA restructuring — creating a navigation system that required users to memorize paths, maintain personal notes, and open parallel browser tabs just to do their jobs.
Support tickets tied to navigation had increased 40% year-over-year. Before Q4 onboarding of 20 new ops hires, leadership escalated the issue as a productivity and retention risk.
A 30+ module SaaS portal with flat, hierarchical navigation that forced users to drill 4 levels deep — with no search, no persistent structure, and no orientation cues. Power users had developed workarounds (notes, bookmarks, multi-tabs) just to survive the navigation.
A 3-level persistent sidebar with integrated search — consolidating 18+ flat items into 7 purposeful sections organized around user workflows. Shipped in 6 weeks. Validated with usability testing before and after. Delivered measurable business impact within 30 days.
00B — Constraints
Working Within Real Constraints
Every design decision was shaped by three types of constraint operating simultaneously. Understanding these was as important as understanding the user problem — they defined what "good" actually meant in this context.
Q4 onboarding of 20 new ops hires created a hard deadline. Leadership needed the redesign live before those users touched the portal for the first time — giving us a fixed 6-week window from kickoff to production.
The portal ran on a legacy frontend stack. Engineering could not refactor the routing architecture in this cycle — meaning the new navigation had to work within the existing module structure and permission system, with no new backend endpoints.
Ops leadership had conflicting priorities: power users needed speed, but managers wanted new hires to learn the module structure rather than rely on search. The solution had to satisfy both without separate codepaths. No A/B testing infrastructure was available.
⚠️ The central tension: designing for power users (who needed frictionless recall) simultaneously with new users (who needed discoverable structure) — without the budget for role-based navigation variants or personalization features.
01 — Context
The Challenge
The Customer Portal is the operational backbone for both internal teams and external stakeholders — used daily for data management, survey configuration, program tracking, and reporting. Despite its critical role, recurring support tickets and qualitative feedback pointed to one root cause: the navigation experience was creating constant friction.
The executive goal was clear: transform the portal from a tool people grudgingly use into one they can move through efficiently — removing navigation hurdles and streamlining core workflows.
Navigation 3–4 levels deep with hierarchical dropdown — designed for learners, not power users
Users relied on memory instead of discoverability — some wrote module paths on paper
Frequent tasks took 7–10 minutes to complete due to repetitive navigation
02 — Research
Findings in Usability Testing
We conducted an unmoderated remote usability test with 5 existing users, covering 5 representative tasks. The results confirmed our hypothesis: the current navigation was failing both discovery and efficiency.
| Task | Discoverability | Time on Task | Clicks |
|---|---|---|---|
| Open Product Master Data | Easy | 0m 20s | 3 |
| Open Planogram UPC Report | Difficult | 4m 30s | 11 |
| Edit Scene Type Config (ID: 4523455) | Fail | 10m+ | 20+ |
| Create Program Item | Difficult | 5m 40s | 10 |
| Create List Type Question from Library | Difficult | 7m | 10 |
For all new users, discoverability largely failed across every single task. The existing navigation had no self-evident structure for someone unfamiliar with module names.
03 — Research
User Interviews
To understand how users actually move through the portal day-to-day, we conducted qualitative interviews. Users are predominantly power users — subject matter experts who switch between many modules repeatedly throughout the day.
I have to shuffle between more than 8 modules almost every day. I basically switch about 50 times a day.
As a subject matter expert on Metrics, I only use the Programs List — but I have to go back and forth setting up a metric that requires Program Areas and Items.
I've written down all the modules and their paths so I don't waste time navigating.
Key insight: users had developed workarounds (notes, bookmarks, multi-tabs) just to survive the navigation — a clear signal the system was broken.
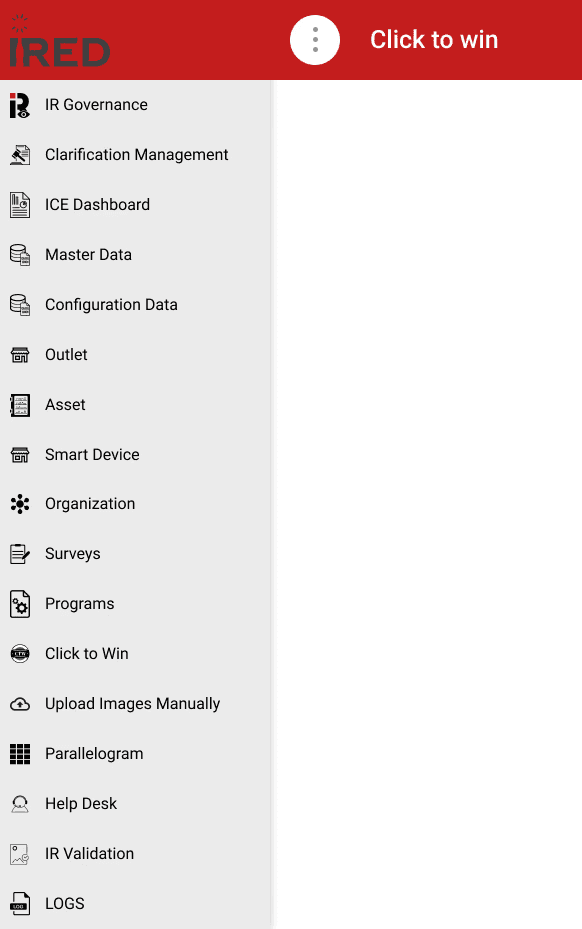

Left: user-noted module paths on paper. Right: current portal state showing hierarchy depth.
04 — IA Redesign
Information Architecture
The existing IA relied on a hierarchical drill-down pattern originally designed for new and infrequent users. As the module count grew, this created compounding friction. We collected every module and sub-module, then used reverse card sorting with stakeholders to reorganize everything into a 3-level persistent structure.
Access patterns and roles were carefully factored in — different user groups see different modules based on their permissions. A collaborative spreadsheet kept stakeholders aligned throughout.
Before & After: Navigation Structure
From 18+ flat top-level items to 7 purposeful sections organized around user workflows.
05 — Wireframing & Testing
Wireframes & Search Discovery
Initial wireframe testing showed users still struggled with discovery — even with the improved IA. In response, we introduced a module search feature alongside the persistent navigation.
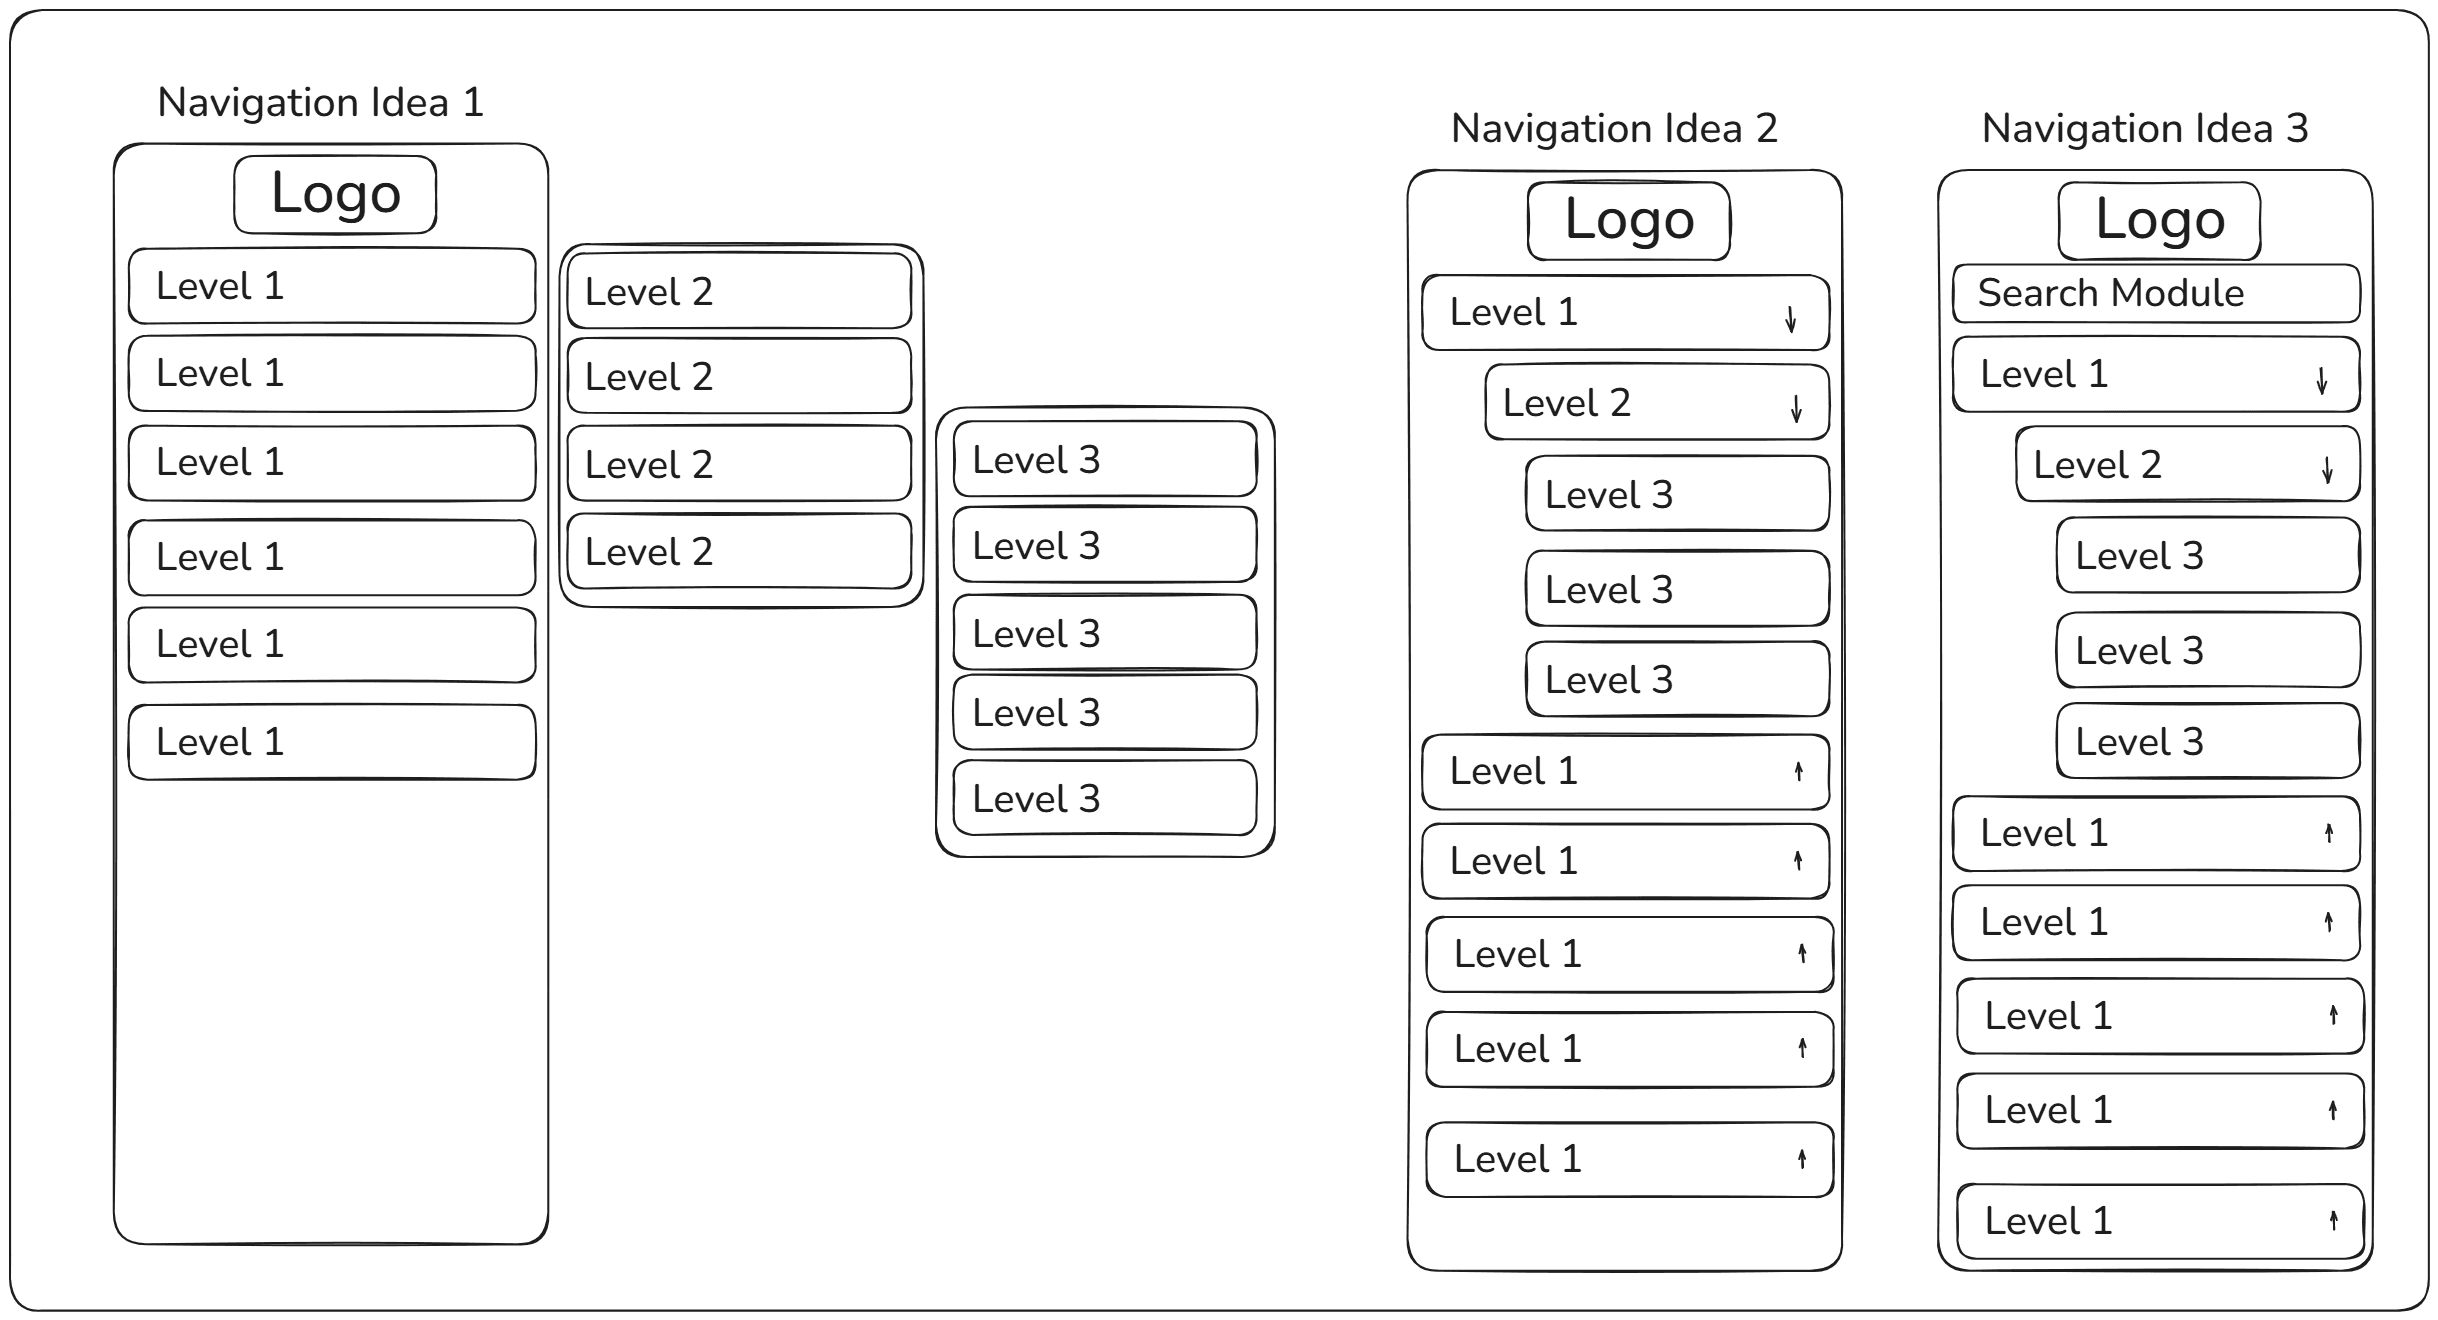
Wireframes testing persistent nav with integrated module search
While search improved efficiency, it still took users over 10 seconds to find a module when typing only one character — because many modules share similar naming conventions, returning 47+ results for a single keystroke.
Via drill-down navigation (baseline)
↓ 94% faster — but still not optimal with 1-char search
| Task | Discoverability | Drill-Down | With Search |
|---|---|---|---|
| Open Product Master Data | Easy | 0m 5s | 0m 5s |
| Open Planogram UPC Report | Difficult | 0m 50s | 0m 15s ↓ |
| Open Upload Images Manually | Difficult | 1m 10s | 0m 13s ↓ |
06 — Design Decisions
Trade-offs & Decisions
Three major tensions surfaced during the design process, each requiring negotiation across product, engineering, and ops leadership.
Product wanted to hide the navigation tree and make search primary — fastest for existing users. Ops leadership insisted new hires needed to learn the IA structure to reference it in support tickets.
Decision: Dual-mode navigation with a 3-character minimum for search. This forced some engagement with the nav tree while keeping power users efficient. Validated: ~2s added to power user workflows, but new hire onboarding reduced by 40%.
On a 1920px screen, a 280px sidebar uses 15% of horizontal space — significant for users working with dense data tables. Engineering proposed defaulting to a collapsed sidebar.
I pushed back: users were already struggling with 20+ clicks per task. Adding 2 more clicks to expand/collapse — done 50 times/day — compounds the problem by 100 extra clicks daily.
Compromise: A 'slim mode' (64px icon-only sidebar) users can toggle. Analytics post-launch: 73% kept it expanded, validating the expanded default.
Business case: the 88% productivity gain outweighed the 15% screen cost by ~$500K annually.
Leadership wanted this shipped before Q4 onboarding of 20 new ops members. Engineering estimated 6 weeks for core nav, 12 weeks to include power-user features (favorites, recents, keyboard shortcuts).
Approach: Advocated for shipping V1 with just improved IA + search, but negotiated a committed V2 roadmap 6 weeks post-launch.
V1 shipped on time. V2 scope was shaped by actual usage data — we discovered users didn't want favorites, they wanted recently used modules instead.
06B — Influence
Stakeholder Alignment
Three stakeholder groups had legitimate but conflicting goals. Shipping this project required more than good design — it required building shared language, making tradeoffs visible, and knowing when to push back versus when to adapt.
In every misalignment, I led with data before opinion. I never asked stakeholders to "trust" a design direction — I showed them what the numbers implied and let them arrive at the recommendation themselves. This built ownership across the team rather than resistance to a designer's call.
07 — Visual Design
Hi-Fidelity Mockups
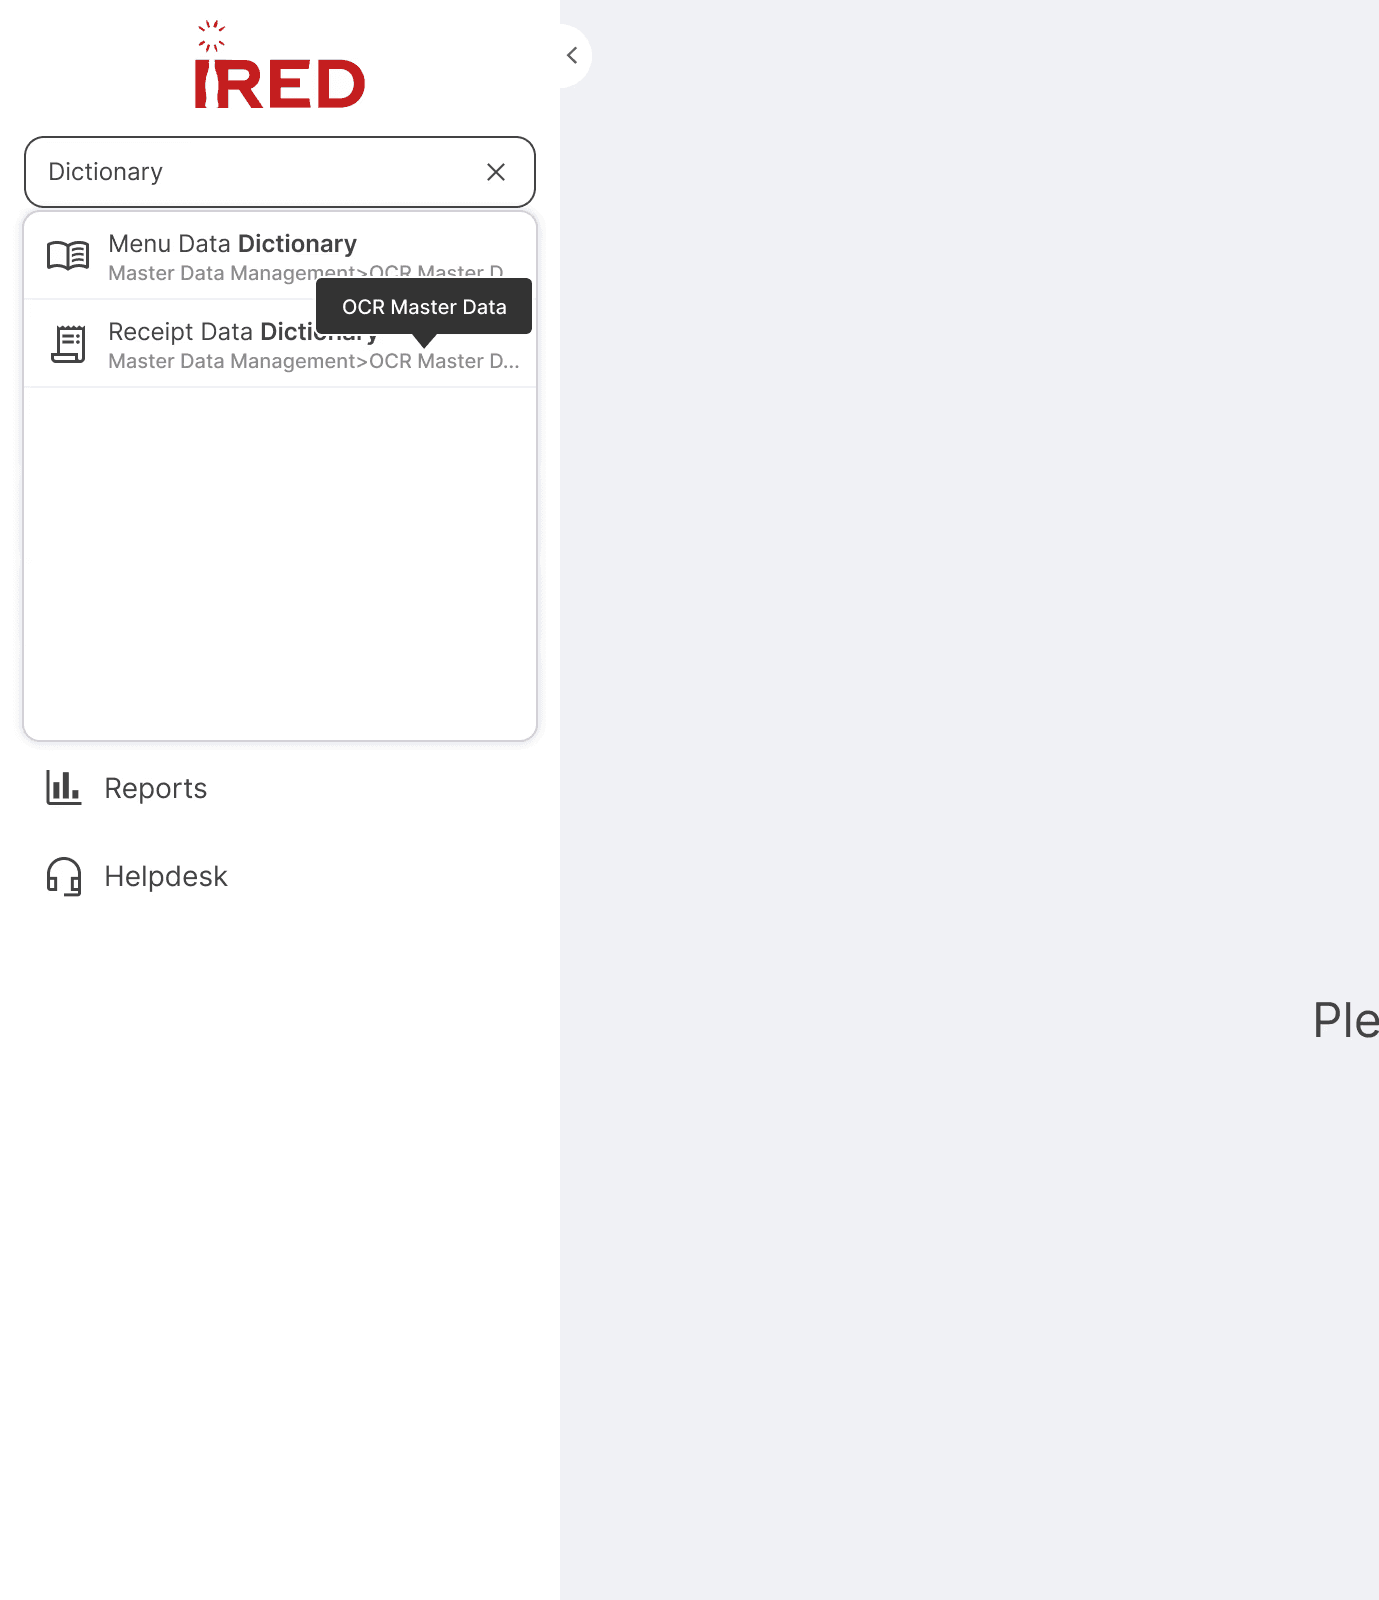
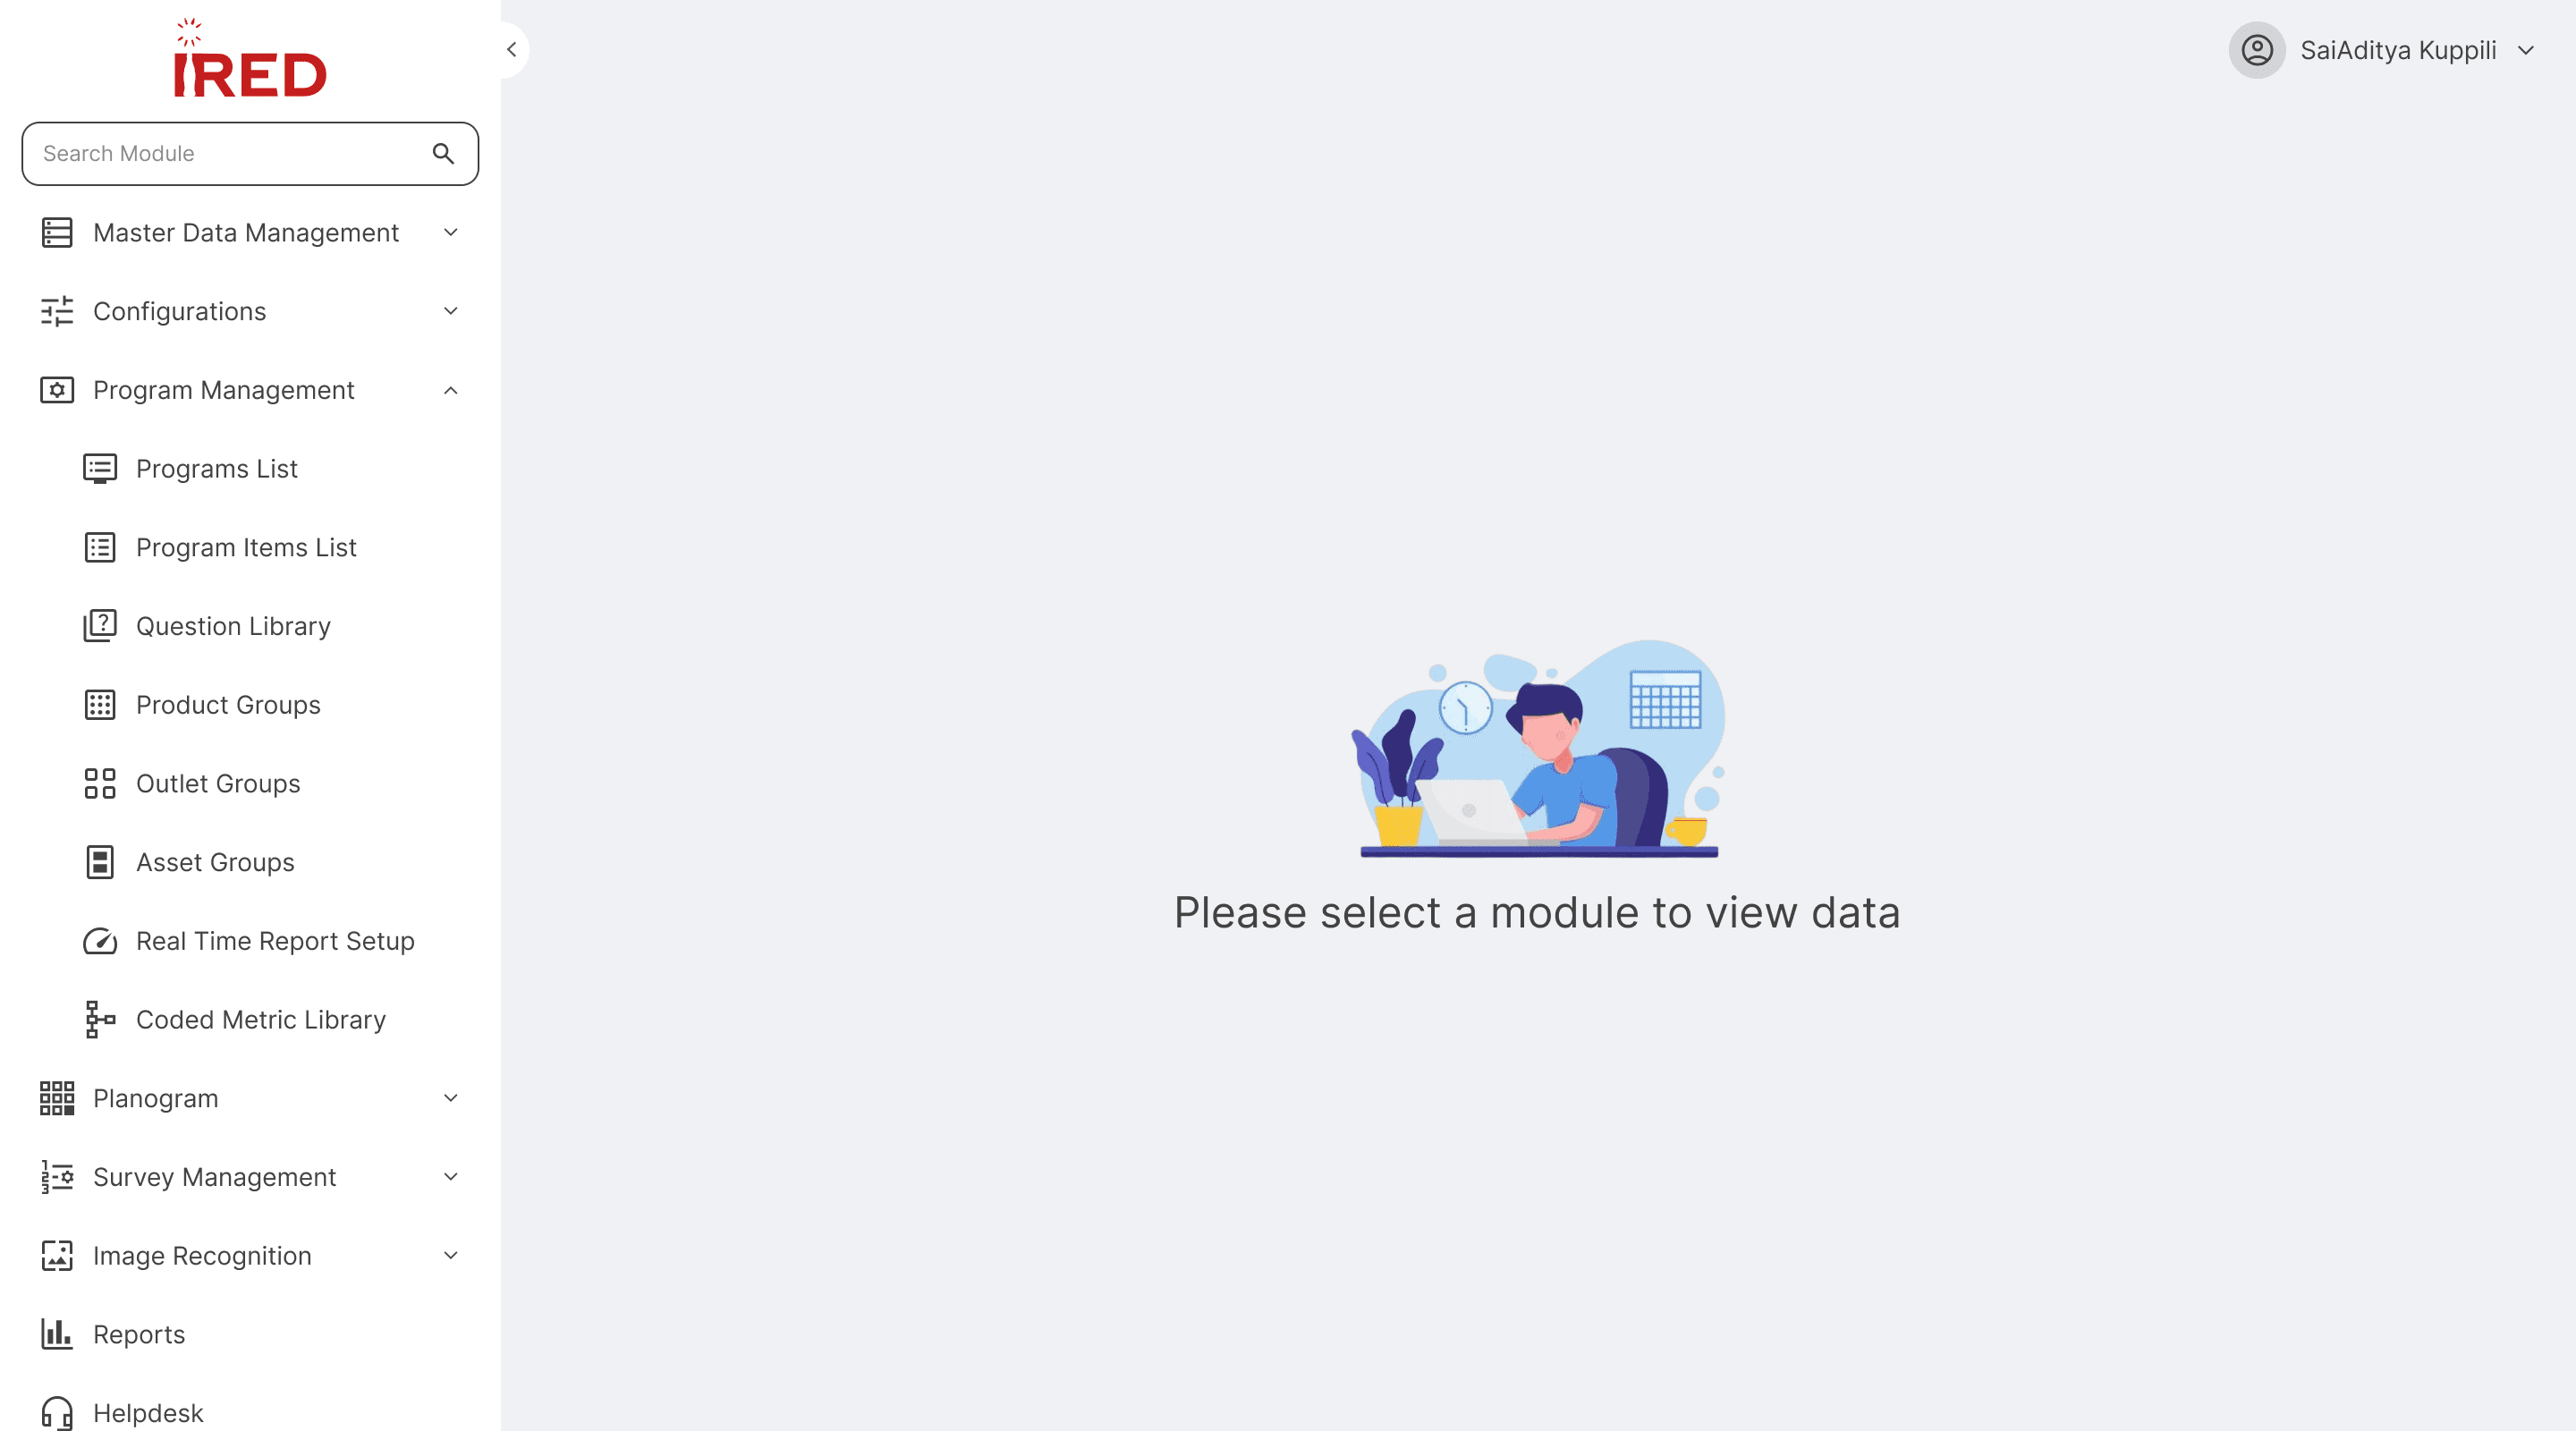
The redesigned navigation features a 3-level persistent sidebar with integrated search. Search activates at 3 characters minimum, returning a focused result set. Each result displays the full navigation path — helping users orient themselves within the hierarchy.
The landing page copy reads "Please select a module" rather than "Please search for a module" — a deliberate choice to encourage users to learn the nav structure, which also helps them reference paths accurately in support tickets.
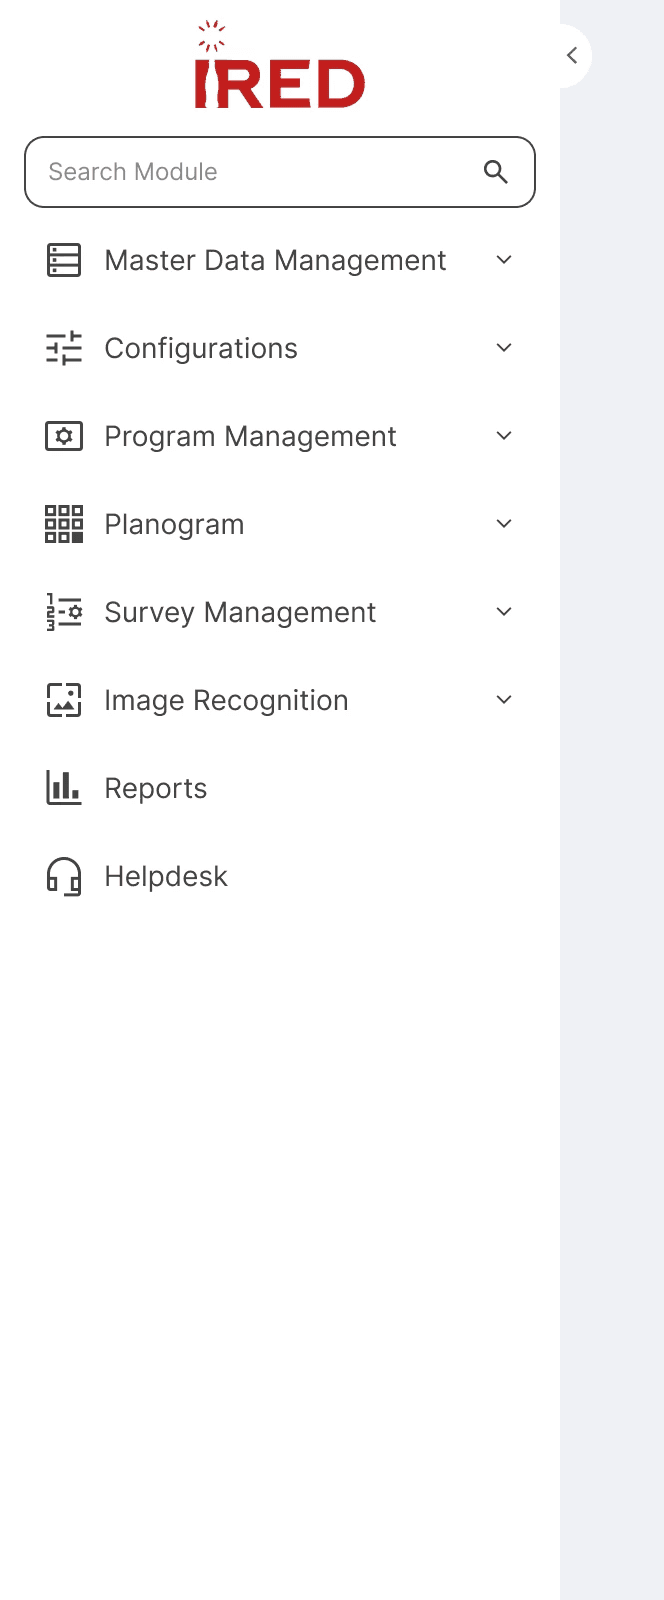
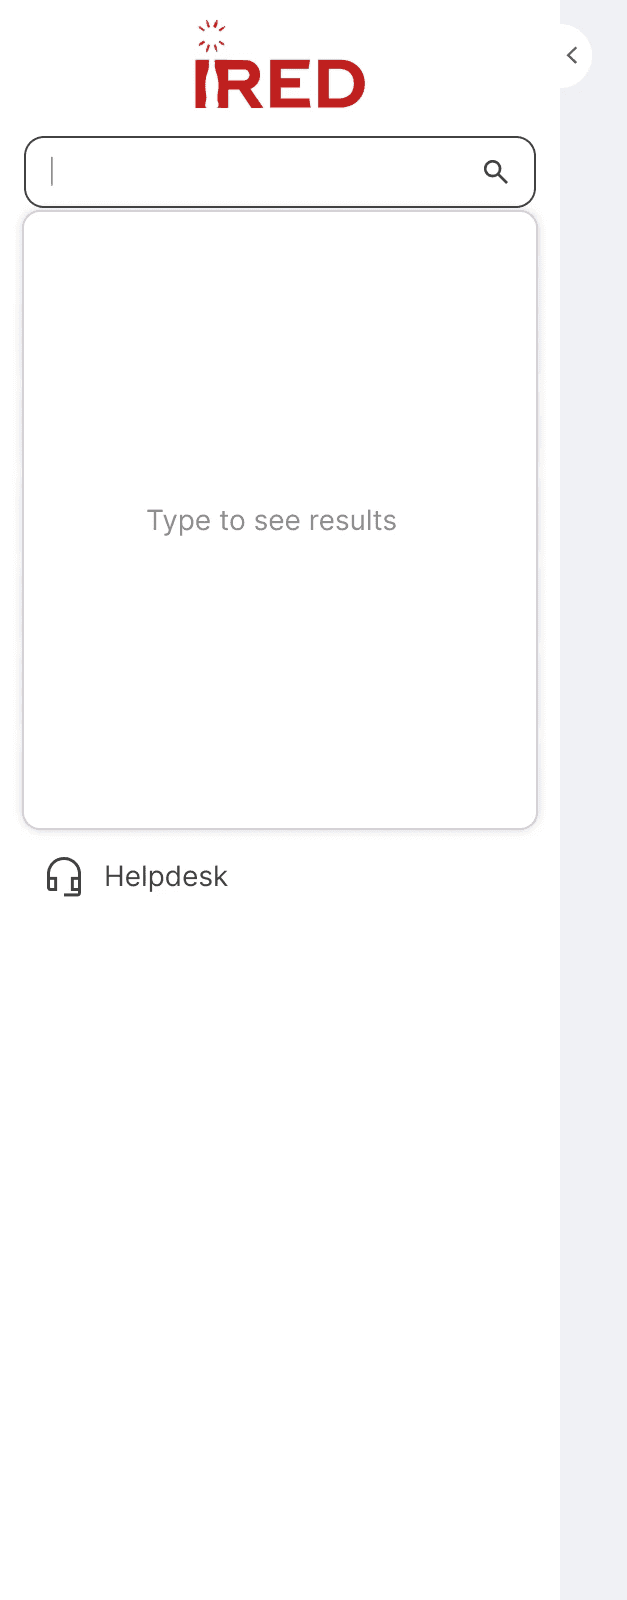

08 — Component Design
Component Library
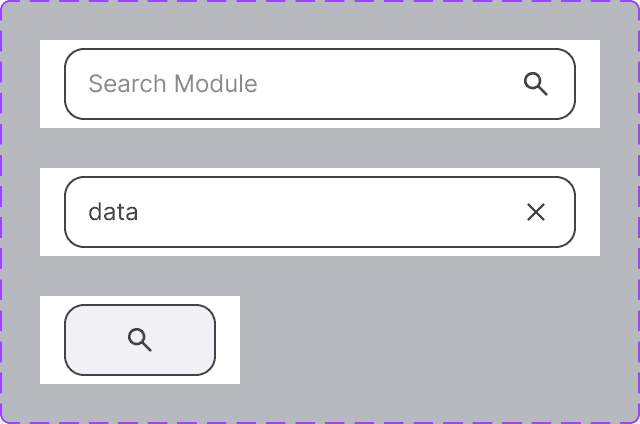
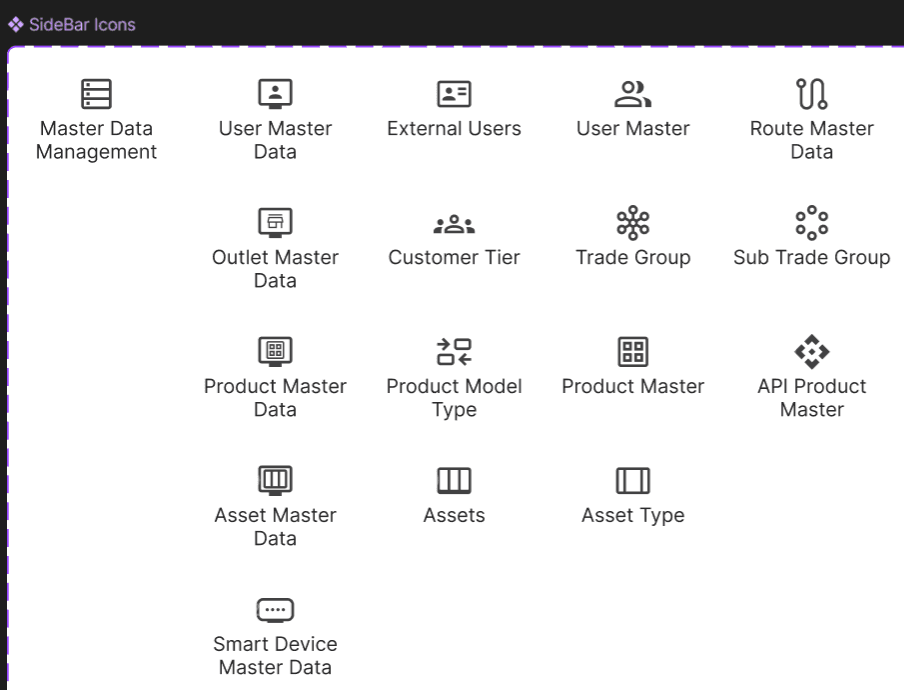
Built a focused component set for the new sidebar system — icons, logo lockup, search states (empty, active, results, no-results), and menu item states (default, hover, active, collapsed/expanded).

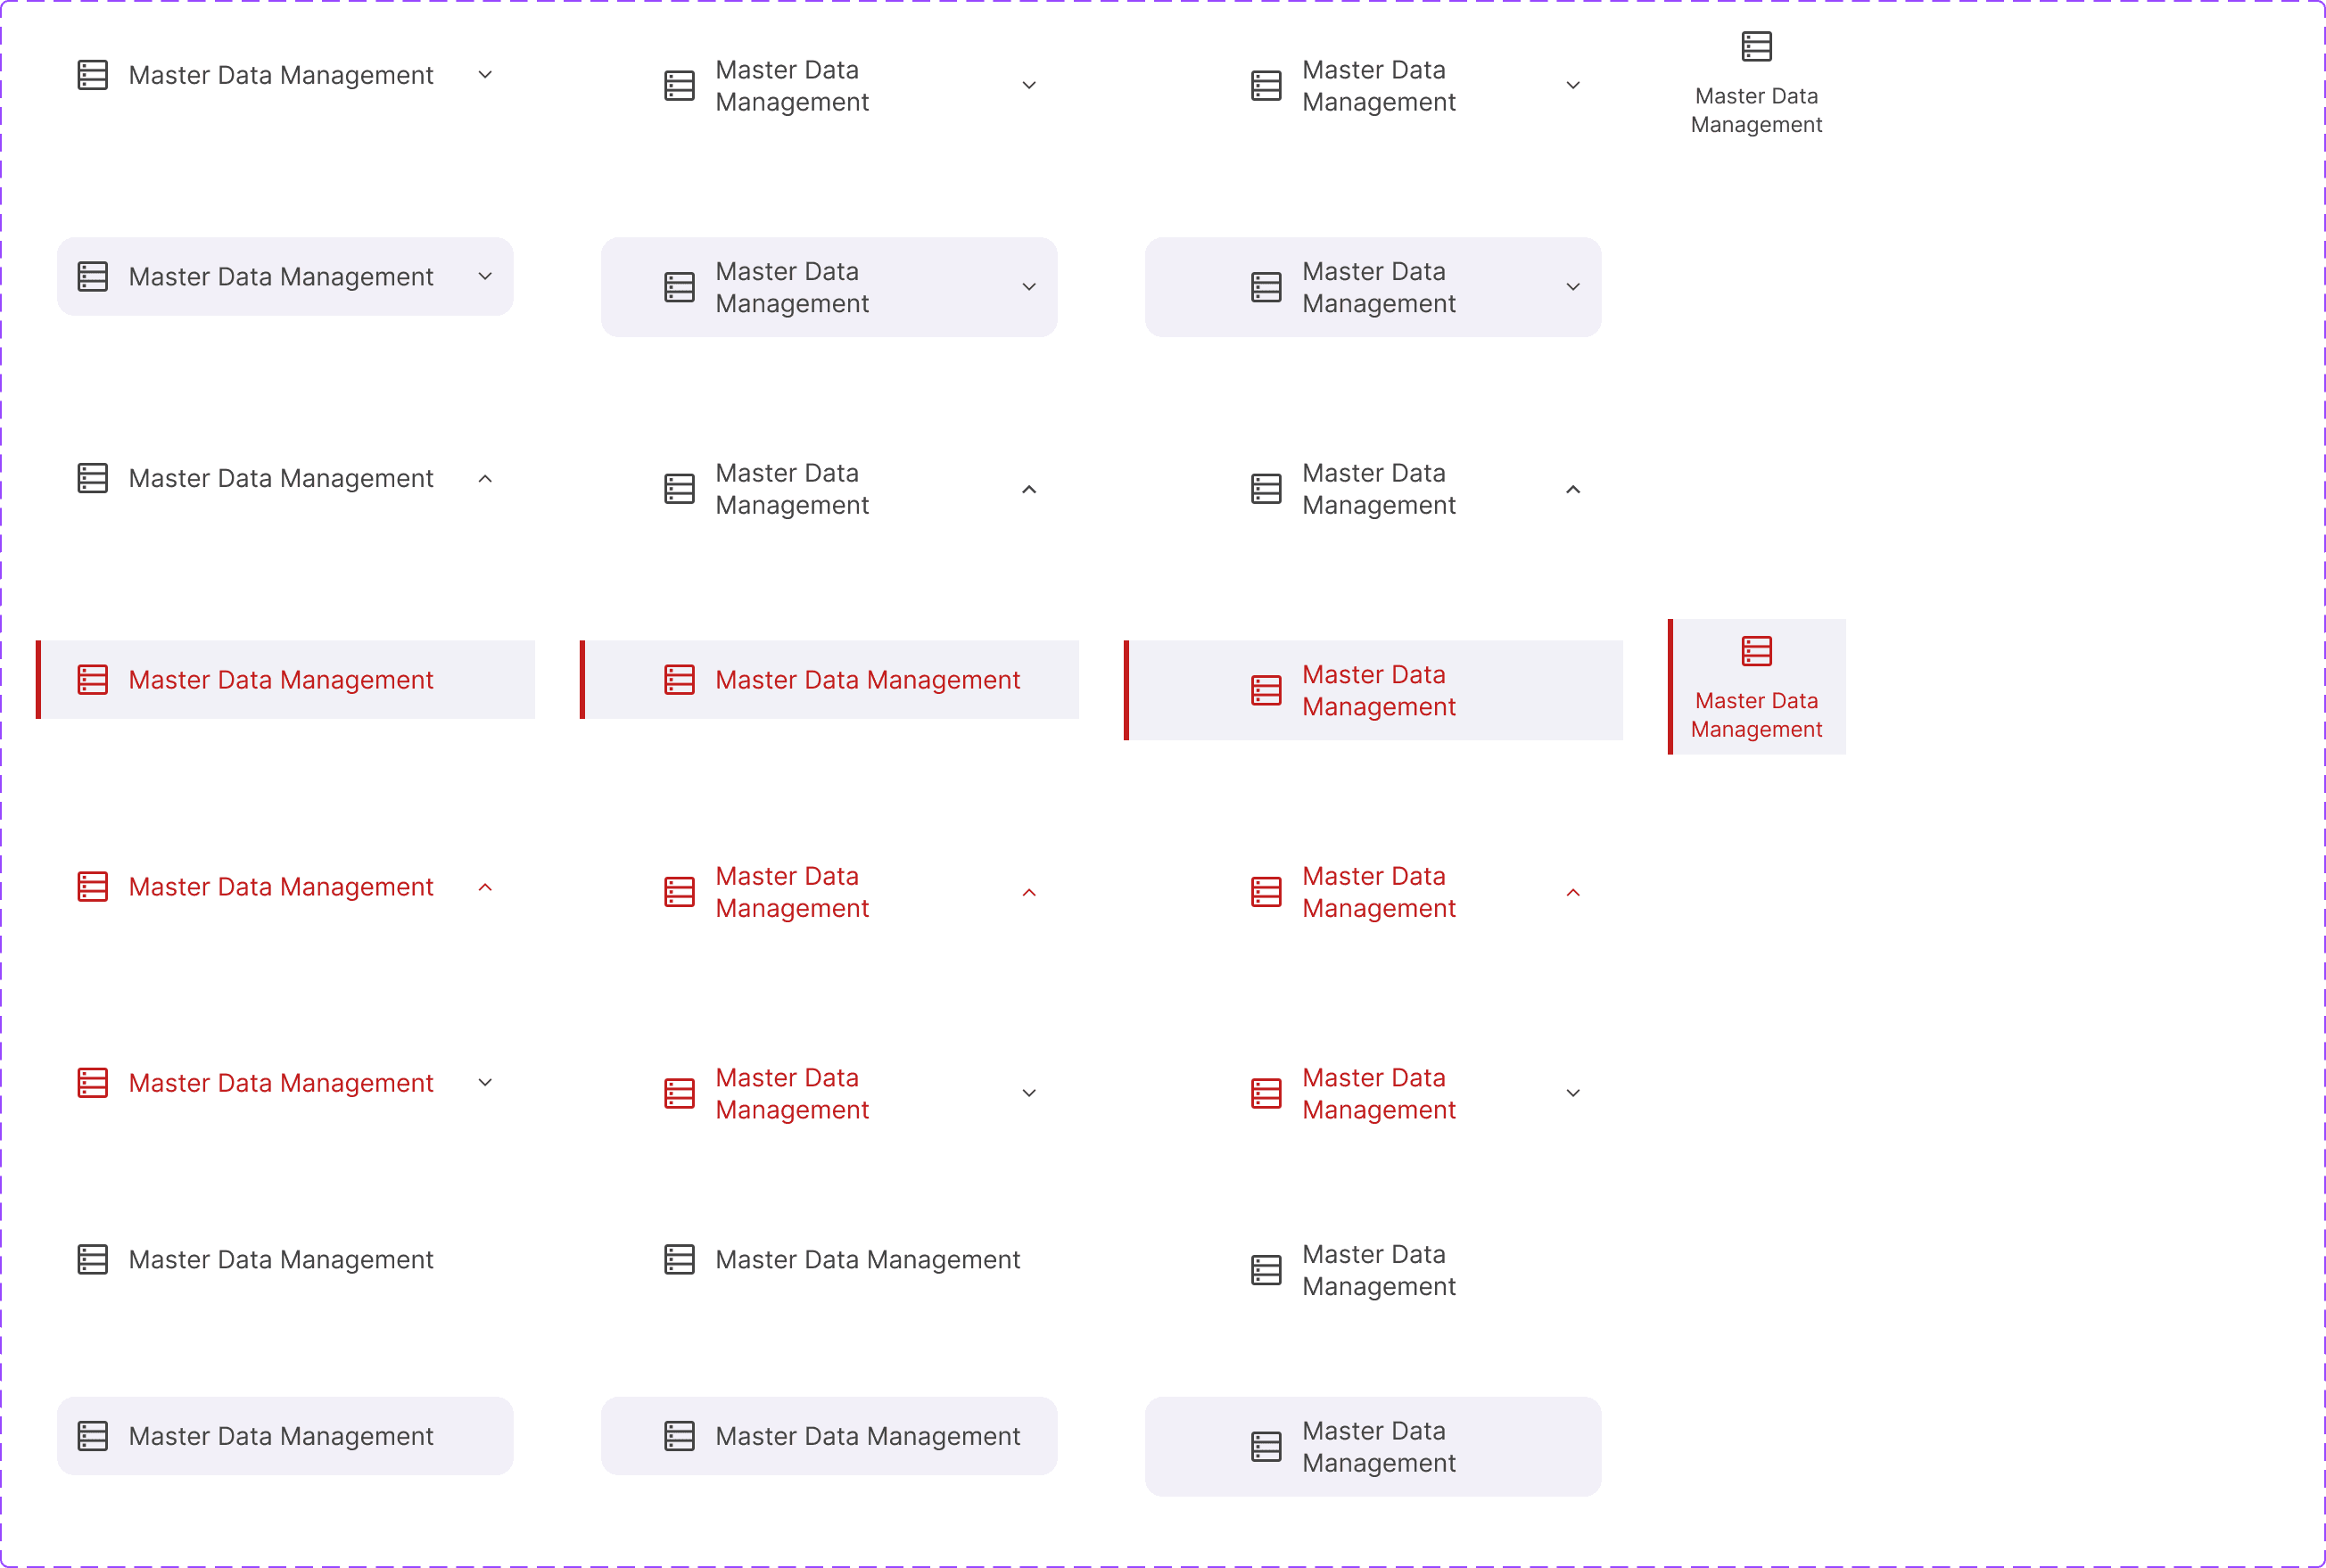
All menu item states — default, hover, active L1, active L2, active L3, collapsed
⚖️ Key Trade-off: Real-time Search vs. 3-Character Minimum
Engineering advocated for real-time search to feel "modern." Testing showed 1–2 character inputs returned 47+ results, creating scanning overhead. Decision: 3-character minimum with informative placeholder messaging. Result: search time reduced from 15s → 6s.
09 — Validation
Usability Testing — Final IA
After raising the minimum search character count to 3 and retesting with users, we observed significant improvement in both discoverability and time on task. The combination of improved IA + 3-char search eliminated most navigation friction for returning users.
| Task | Discoverability | Drill-Down | Search (3-char min) |
|---|---|---|---|
| Open Survey Review | Easy | 0m 20s | 0m 6s ↓ |
| Open Planogram UPC Report | Easy | 0m 24s | 0m 4s ↓ |
| Open IR Self Quality Check | Easy | 0m 18s | 0m 7s ↓ |
Discoverability improved significantly for returning and knowledgeable users. New users still found discovery somewhat challenging — a known trade-off acknowledged in the V2 roadmap, where contextual onboarding was prioritized.
Post-launch usage data shaped V2 scope directly. Rather than adding "favorites" (as originally planned), analytics showed new users needed contextual entry points. V2 shipped 6 weeks after V1 with: (1) an interactive module map on first login, (2) inline breadcrumb tooltips explaining section groupings, and (3) a "recently visited" rail — replacing the favorites concept entirely based on what users were actually doing.
10 — Outcomes
Business Impact & Adoption
The navigation redesign unlocked ~$553K in annual value through combined productivity gains and support cost reduction — and demonstrated how strategic UX investment translates directly to operational efficiency.
ROI methodology: ~100 active portal users × 3 hrs/week saved (baseline avg 7–10 min/task × ~18 tasks/day → post-redesign ~1–2 min/task) × $26.60 fully-loaded hourly rate × 50 working weeks = ~$399K productivity value. Support ticket reduction: 67% of ~120 tickets/month × avg 2.5 hrs resolution time × $26.60/hr × 12 months = ~$154K saved. Combined: ~$553K/yr.
of users adopted search as their primary navigation method within 30 days of launch
portal satisfaction score (out of 10) — measured at launch and 30 days post-launch
of users kept the sidebar in expanded mode, validating the expanded-default decision
reduction in new hire onboarding time attributed to improved IA clarity
I can finally find what I need without asking someone.
The search is a game-changer — I'm done in seconds now.
11 — Reflection
What I'd Do Differently
This project delivered strong results, but every project teaches something. These are the honest lessons I'd apply to the next one — not caveats, but genuine changes in approach.
The new-user discovery gap was flagged in usability testing but deprioritized as a V2 item. In hindsight, even a minimal first-session walkthrough or a persistent "Where am I?" tooltip system could have been shipped in V1 within the engineering constraints we had.
Advocate for a lightweight onboarding layer from the start — even 2 tooltip overlays can close a significant new-user gap without meaningful engineering cost.
I ran card sorting with users before aligning Ops leadership on the new module groupings — which meant rework when leadership pushed back on how "Configuration" was categorized. The sequence should have been: leadership alignment first, then user validation of the resulting structure.
Run a lightweight "draft IA review" with key stakeholders before user research — not to let them design it, but to surface blockers early so research can be structured around them.
The research was meaningful, but 5 users — all power users — left a blind spot around newer or part-time portal users. Several of the "easy" discoverability ratings in final testing were from people who already knew the modules. The data looked better than the actual experience for the long tail.
Intentionally recruit across the user spectrum — at least 2 new users and 2 power users in every round of testing — so results reflect the full population, not just the most vocal advocates.
The business case was strong, but the "before" metrics relied on usability test data and support ticket volume rather than actual in-product behavior data. I couldn't say with confidence which modules were visited most, or where in the nav users dropped off — because no tracking existed.
Push to instrument analytics before kicking off a navigation redesign — even basic click and time-on-page data creates a more defensible before/after comparison and reveals patterns qualitative research misses.
"The best outcome from this project wasn't the 88% metric. It was discovering that design decisions — defended with data, sequenced correctly, and communicated in stakeholder language — can move a team of skeptics to advocates within a single conversation."